
An execution plan describes the process by which an SQL query is executed in a database. You can use the EXPLAIN command to view the logical execution plan generated by the optimizer for a specified SQL statement.
To analyze the performance of an SQL statement, you typically need to first examine its execution plan to identify any issues with each step of the execution. Therefore, understanding execution plans is a prerequisite for SQL optimization, and knowing the operators in an execution plan is key to understanding the EXPLAIN command.
EXPLAIN command format
OceanBase AI Database supports three modes for the execution plan command: EXPLAIN BASIC, EXPLAIN, and EXPLAIN EXTENDED. These modes present execution plans at different levels of detail:
The
EXPLAIN BASICcommand displays the most basic plan information.The
EXPLAIN EXTENDEDcommand displays the most detailed plan information and is usually used when troubleshooting.The
EXPLAINcommand displays information that helps users understand how the entire plan is executed.
The EXPLAIN command format is as follows:
EXPLAIN [INTO table_name ] [SET statement_id = string] [explain_type] [PRETTY | PRETTY_COLOR] dml_statement;

explain_type:
    BASIC
  | OUTLINE
  | EXTENDED
  | EXTENDED_NOADDR
  | PARTITIONS
  | FORMAT = {TRADITIONAL| JSON}

dml_statement:
    SELECT statement
  | DELETE statement
  | INSERT statement
  | UPDATE statement
  | REPLACE statement
The EXPLAIN command applies to SELECT, DELETE, INSERT, REPLACE, and UPDATE statements. It displays information about the execution plan provided by the optimizer, including how the statement is processed, how tables are joined, and in what order they are joined.
Generally, you can use the EXPLAIN EXTENDED command to display the range segments scanned by tables. Use the EXPLAIN OUTLINE command to display outline information.
The FORMAT option allows you to select the output format. TRADITIONAL means the output is displayed in a table format, which is also the default setting. JSON means the information is displayed in JSON format.
You can also use EXPLAIN PARTITIONS to check queries involving partitioned tables. If checking a non-partitioned table, no error will be returned, but the value in the PARTITIONS column will always be NULL.
Specifically, you can use the INTO table_name SQL statement to save the EXPLAIN plan information into a specified table. By default, it queries the PLAN_TABLE table. Use the SET statement_id statement to mark the current query with a string for easy later retrieval of its plan information. An empty string is used as the marker by default. For more details, see EXPLAIN.
For complex execution plans, you can use the PRETTY or PRETTY_COLOR option to connect parent and child nodes in the plan tree with lines or colored lines, making the execution plan easier to read. Example:
obclient> CREATE TABLE p1table(c1 INT ,c2 INT) PARTITION BY HASH(c1) PARTITIONS 2;
Query OK, 0 rows affected

obclient> CREATE TABLE p2table(c1 INT ,c2 INT) PARTITION BY HASH(c1) PARTITIONS 4;
Query OK, 0 rows affected

obclient> EXPLAIN EXTENDED PRETTY_COLOR SELECT  * FROM p1table p1 JOIN p2table p2 ON p1.c1=p2.c2;
*************************** 1. row ***************************
Query Plan: ==========================================================
|ID|OPERATOR                     |NAME    |EST. ROWS|COST|
----------------------------------------------------------
|0 |PX COORDINATOR               |        |1        |278 |
|1 | EXCHANGE OUT DISTR          |:EX10001|1        |277 |
|2 |  HASH JOIN                  |        |1        |276 |
|3 |  ├PX PARTITION ITERATOR     |        |1        |92  |
|4 |  │ TABLE SCAN               |P1      |1        |92  |
|5 |  └EXCHANGE IN DISTR         |        |1        |184 |
|6 |    EXCHANGE OUT DISTR (PKEY)|:EX10000|1        |184 |
|7 |     PX PARTITION ITERATOR   |        |1        |183 |
|8 |      TABLE SCAN             |P2      |1        |183 |
==========================================================

Outputs & filters:
-------------------------------------
  0 - output([INTERNAL_FUNCTION(P1.C1, P1.C2, P2.C1, P2.C2)]), filter(nil)
  1 - output([INTERNAL_FUNCTION(P1.C1, P1.C2, P2.C1, P2.C2)]), filter(nil), dop=1
  2 - output([P1.C1], [P2.C2], [P1.C2], [P2.C1]), filter(nil),
      equal_conds([P1.C1 = P2.C2]), other_conds(nil)
  3 - output([P1.C1], [P1.C2]), filter(nil)
  4 - output([P1.C1], [P1.C2]), filter(nil),
      access([P1.C1], [P1.C2]), partitions(p[0-1])
  5 - output([P2.C2], [P2.C1]), filter(nil)
  6 - (#keys=1, [P2.C2]), output([P2.C2], [P2.C1]), filter(nil), dop=1
  7 - output([P2.C1], [P2.C2]), filter(nil)
  8 - output([P2.C1], [P2.C2]), filter(nil),
      access([P2.C1], [P2.C2]), partitions(p[0-3])

1 row in set
Execution plan shapes and operator information
In a database system, execution plans are typically represented internally as trees, but different databases choose different ways to present them to users.
The following examples show how the execution plans for TPC-DS Q3 are presented in PostgreSQL, Oracle Database, and OceanBase AI Database, respectively.
obclient> SELECT /*TPC-DS Q3*/ *
     FROM (SELECT dt.d_year,
                  item.i_brand_id    brand_id,
                  item.i_brand       brand,
                  Sum(ss_net_profit) sum_agg
           FROM   date_dim dt,
                  store_sales,
                  item
           WHERE  dt.d_date_sk = store_sales.ss_sold_date_sk
                  AND store_sales.ss_item_sk = item.i_item_sk
                  AND item.i_manufact_id = 914
                  AND dt.d_moy = 11
           GROUP  BY dt.d_year,
                     item.i_brand,
                     item.i_brand_id
           ORDER  BY dt.d_year,
                     sum_agg DESC,
                     brand_id)
     WHERE ROWNUM <= 100;
The execution plan in PostgreSQL is as follows:
Limit  (cost=13986.86..13987.20 rows=27 width=91)
         Sort  (cost=13986.86..13986.93 rows=27 width=65)
         Sort Key: dt.d_year, (sum(store_sales.ss_net_profit)), item.i_brand_id
              HashAggregate  (cost=13985.95..13986.22 rows=27 width=65)
                     Merge Join  (cost=13884.21..13983.91 rows=204 width=65)
                     Merge Cond: (dt.d_date_sk = store_sales.ss_sold_date_sk)
                           Index Scan using date_dim_pkey on date_dim dt  (cost=0.00..3494.62 rows=6080 width=8)
                           Filter: (d_moy = 11)
                           Sort  (cost=12170.87..12177.27 rows=2560 width=65)
                           Sort Key: store_sales.ss_sold_date_sk
                                 Nested Loop  (cost=6.02..12025.94 rows=2560 width=65)
                                       Seq Scan on item  (cost=0.00..1455.00 rows=16 width=59)
                                       Filter: (i_manufact_id = 914)
                                       Bitmap Heap Scan on store_sales  (cost=6.02..658.94 rows=174 width=14)
                                       Recheck Cond: (ss_item_sk = item.i_item_sk)
                                             Bitmap Index Scan on store_sales_pkey  (cost=0.00..5.97 rows=174 width=0)
                                             Index Cond: (ss_item_sk = item.i_item_sk)
The execution plan in Oracle Database is as follows:
Plan hash value: 2331821367
--------------------------------------------------------------------------------------------------
| Id  | Operation                         | Name         | Rows  | Bytes | Cost (%CPU)| Time     |
--------------------------------------------------------------------------------------------------
|   0 | SELECT STATEMENT                  |              |   100 |  9100 |  3688   (1)| 00:00:01 |
|*  1 |  COUNT STOPKEY                    |              |       |       |            |          |
|   2 |   VIEW                            |              |  2736 |   243K|  3688   (1)| 00:00:01 |
|*  3 |    SORT ORDER BY STOPKEY          |              |  2736 |   256K|  3688   (1)| 00:00:01 |
|   4 |     HASH GROUP BY                 |              |  2736 |   256K|  3688   (1)| 00:00:01 |
|*  5 |      HASH JOIN                    |              |  2736 |   256K|  3686   (1)| 00:00:01 |
|*  6 |       TABLE ACCESS FULL           | DATE_DIM     |  6087 | 79131 |   376   (1)| 00:00:01 |
|   7 |       NESTED LOOPS                |              |  2865 |   232K|  3310   (1)| 00:00:01 |
|   8 |        NESTED LOOPS               |              |  2865 |   232K|  3310   (1)| 00:00:01 |
|*  9 |         TABLE ACCESS FULL         | ITEM         |    18 |  1188 |   375   (0)| 00:00:01 |
|* 10 |         INDEX RANGE SCAN          | SYS_C0010069 |   159 |       |     2   (0)| 00:00:01 |
|  11 |        TABLE ACCESS BY INDEX ROWID| STORE_SALES  |   159 |  2703 |   163   (0)| 00:00:01 |
--------------------------------------------------------------------------------------------------
The execution plan in OceanBase AI Database is as follows:
|ID|OPERATOR              |NAME       |EST. ROWS|COST |
-------------------------------------------------------
|0 |LIMIT                 |           |100      |81141|
|1 | TOP-N SORT           |           |100      |81127|
|2 |  HASH GROUP BY       |           |2924     |68551|
|3 |   HASH JOIN          |           |2924     |65004|
|4 |    SUBPLAN SCAN      |VIEW1      |2953     |19070|
|5 |     HASH GROUP BY    |           |2953     |18662|
|6 |      NESTED-LOOP JOIN|           |2953     |15080|
|7 |       TABLE SCAN     |ITEM       |19       |11841|
|8 |       TABLE SCAN     |STORE_SALES|161      |73   |
|9 |    TABLE SCAN        |DT         |6088     |29401|
=======================================================
You may notice from the examples above that a plan in OceanBase AI Database is similar to that in Oracle Database.
The following table describes the columns of an execution plan in OceanBase AI Database.
Column |
Description |
|---|---|
ID |
The sequence number of the execution tree obtained by preorder traversal, starting from 0. |
OPERATOR |
The name of the operator. |
NAME |
The name of the table or index corresponding to a table operation. |
EST. ROWS |
The estimated number of output rows of the operator. |
COST |
The execution cost of the operator, in microseconds. |
Note
In a table operation, the NAME field displays the name (alias) of the table involved in the operation. If an index is used for access, the name of the index is also displayed in parentheses after the name. For example, t1(t1_c2) indicates that the t1_c2 index is used. If the scan order is reverse, the REVERSE keyword is used to indicate this, for example, t1(t1_c2,REVERSE).
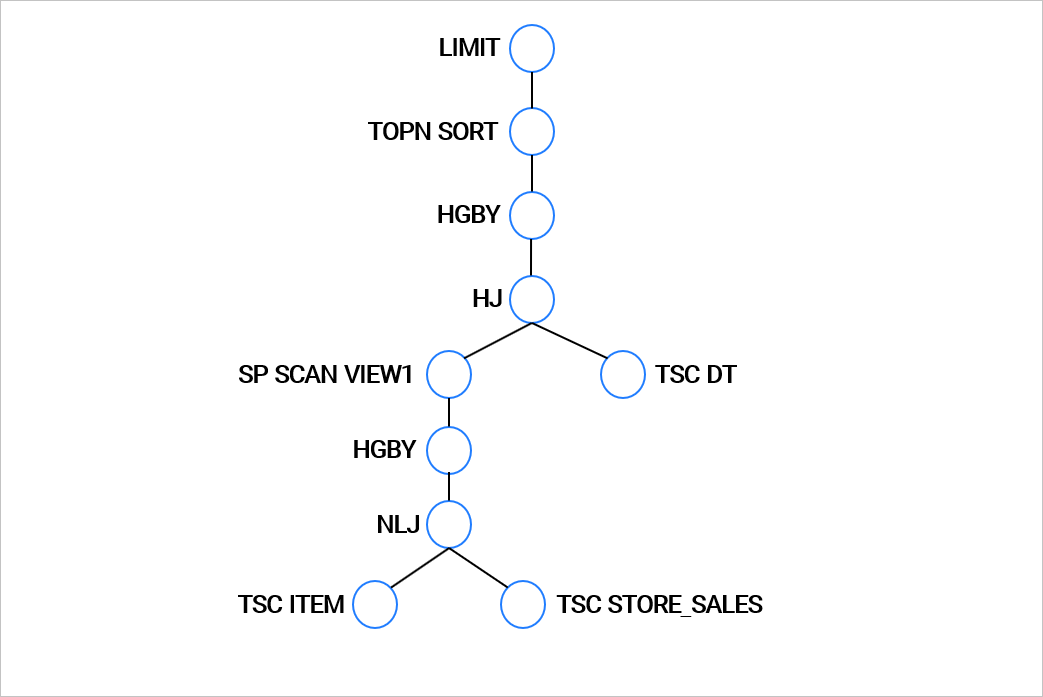
The first part of the output of the EXPLAIN command in OceanBase AI Database is a tree structure representation of the execution plan. The hierarchy of each operation in the tree is indicated by its indentation in operator. Operations with deeper hierarchies are executed first. For operations at the same level, execution follows the standard order of specific operators.
The following figure shows the plan display tree for the TPC-DS Q3 example above:
The second part of the output of the EXPLAIN command in OceanBase AI Database provides detailed information about each operator, including the output expression, filter conditions, partition information, and unique information for each operator (such as the sort keys, join keys, pushdown conditions, etc.). Example:
Outputs & filters:
-------------------------------------
  0 - output([t1.c1], [t1.c2], [t2.c1], [t2.c2]), filter(nil), sort_keys([t1.c1, ASC], [t1.c2, ASC]), prefix_pos(1)
  1 - output([t1.c1], [t1.c2], [t2.c1], [t2.c2]), filter(nil),
      equal_conds([t1.c1 = t2.c2]), other_conds(nil)
  2 - output([t2.c1], [t2.c2]), filter(nil), sort_keys([t2.c2, ASC])
  3 - output([t2.c2], [t2.c1]), filter(nil),
      access([t2.c2], [t2.c1]), partitions(p0)
  4 - output([t1.c1], [t1.c2]), filter(nil),
      access([t1.c1], [t1.c2]), partitions(p0)
To better understand the EXPLAIN information in OceanBase AI Database, see TABLE SCAN.