
This topic describes how to monitor and diagnose the performance of an OceanBase AI Database tenant.
Tenant performance monitoring
Log in to the OceanBase Cloud Platform (OCP) console. In the left-side navigation pane, click Tenants.
In the Tenants list on the Tenant Overview page, find the target tenant and click its name.
In the left-side navigation pane on the page that appears, click Performance Monitoring.
Enable real-time performance monitoring to view the real-time performance changes.
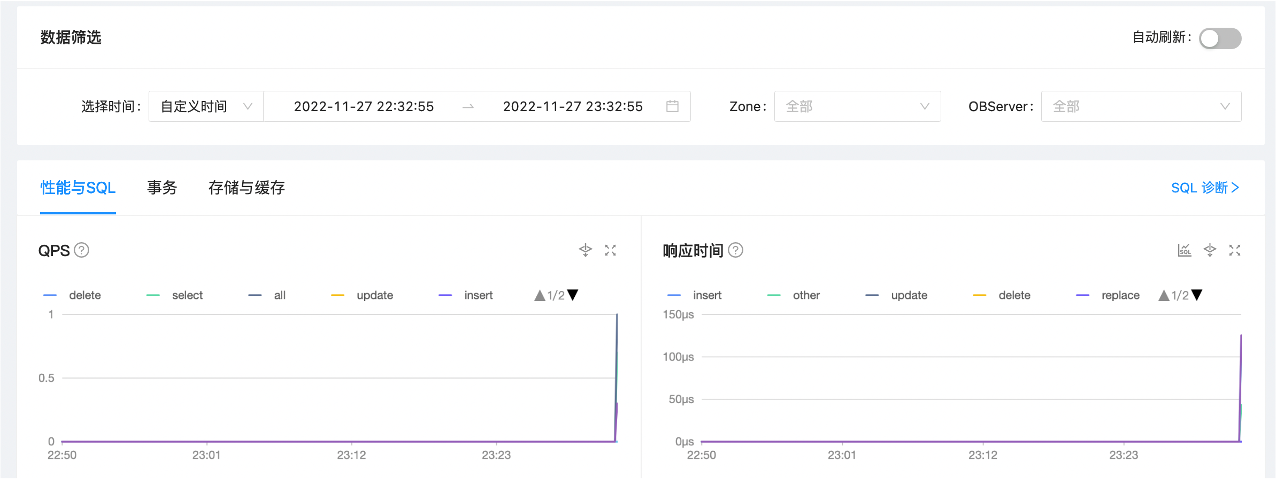
Filter criterion |
Description |
|---|---|
| Selection Time | The time range of the metric data to be displayed. You can view data for the last 30 days. |
| Auto Refresh | By default, auto-refresh is disabled. After auto-refresh is enabled, data is refreshed every 5 seconds. |
| Zone | The zone whose metric data you want to view. OceanBase AI Database is a distributed database, and data replicas of each tenant are distributed in multiple zones. Tenant metrics are collected and aggregated from replicas in multiple zones. The aggregation method depends on the metric type. You can select a zone to show metric data of the replica in the zone. |
| OBServer | The OBServer node whose metric data you want to view. OceanBase AI Database is a distributed database, and data replicas of each tenant are distributed on multiple OBServer nodes. Tenant metrics are collected and aggregated from replicas on multiple OBServer nodes. The aggregation method depends on the metric type. You can select an OBServer node to show metric data of the replica on the OBServer node. |
Tenant performance metrics are classified into the performance and SQL, transaction, and storage and cache categories.
Tenant SQL diagnostics
Applicability
The Community Edition of OCP does not currently support the suspicious SQL diagnostics feature.
Log in to the OCP console. In the left-side navigation pane, click Tenants.
In the Tenants list on the Tenant Overview page, find the target tenant and click its name.
In the left-side navigation pane of the page that appears, click SQL Diagnostics.
OCP provides four features to diagnose SQL statements from the perspectives of performance exceptions, global control, and slow queries.
Feature |
Description |
|---|---|
| Suspicious SQL | The SQL diagnostics engine of OCP identifies SQL statements with performance exceptions and provides diagnostics results. It can identify execution plan changes, performance degradation, and execution spikes. We recommend that you optimize SQL statements preferentially based on the Suspicious SQL diagnostics results. |
| TopSQL | TopSQL diagnostics is also known as full SQL diagnostics. It sorts SQL statements by response time and displays the top 2,000 ones. TopSQL diagnostics provide an overall view of the SQL statements being executed. |
| SlowSQL | The SQL diagnostics engine of OCP extracts SQL statements that take longer than 100 ms in a single execution. You can optimize the statements of slow queries based on the results of SlowSQL diagnostics. |
| ParallelSQL | A parallel SQL statement is an SQL statement executed by using parallel scheduling in a tenant. You can use the ParallelSQL feature to identify SQL statements whose analytical processing (AP) query performance does not meet expectations. |
If no optimal index is specified for an SQL execution plan, you can bind an index on the SQL Details page. After the index is bound, new requests are handled based on the new execution plan.
Session monitoring and diagnostics
Log in to the OCP console. In the left-side navigation pane, click Tenants.
In the Tenants list on the Tenant Overview page, find the target tenant and click its name.
In the left-side navigation pane of the page that appears, click Session Management.
The following table describes the modules of the session management feature.
Module |
Description |
|---|---|
| Tenant Session | This module shows information about the current sessions, including active and inactive sessions. You can kill a specific session. |
| Session Statistics | This module allows you to analyze sessions by user, source IP address, database, and status. |
| Deadlock Analysis | This module supports deadlock diagnostics for the current tenant or a specific session. |
| Active Session History Report | An Active Session History (ASH) report records the active sessions in the last 8 days. You can analyze the session history within any 60 minutes in the last 8 days at a time for troubleshooting. You can view and download the report. OCP retains ASH reports generated in the last 90 days. |