
Overview
The GV$OB_SQL_AUDIT view displays statistics such as the source and execution status of each SQL request on all OBServer nodes. This view is partitioned by tenant. Except for the system tenant, other tenants cannot perform cross-tenant queries.
Columns
Field |
Type |
Nullable |
Description |
|---|---|---|---|
| SVR_IP | varchar(46) | NO | IP Address |
| SVR_PORT | bigint(20) | NO | Port number |
| REQUEST_ID | bigint(20) | NO | Request ID |
| SQL_EXEC_ID | bigint(20) | NO | ID of the current execution |
| TRACE_ID | varchar(128) | NO | The trace ID of this statement |
| SID | bigint(20) unsigned | NO |
|
| CLIENT_IP | varchar(46) | NO |
|
| CLIENT_PORT | bigint(20) | NO | Port number of the client that sends the request |
| TENANT_ID | bigint(20) | NO | Tenant ID for Sending the Request |
| TENANT_NAME | varchar(64) | NO | Tenant Name for Sending Request |
| EFFECTIVE_TENANT_ID | bigint(20) | NO | Tenant ID |
| USER_ID | bigint(20) | NO | User ID of the requester |
| USER_NAME | varchar(64) | NO | Username of the user who sent the request |
| USER_GROUP | bigint(20) | YES | Resource group ID |
| USER_CLIENT_IP | varchar(46) | NO | IP Address of the Client Sending the Request |
| DB_ID | bigint(20) unsigned | NO | Database ID |
| DB_NAME | varchar(128) | NO | Database Name |
| SQL_ID | varchar(32) | NO | SQL ID
NoteFor PL requests executed by the CALL statement and those executed via anonymous blocks, this field displays the actual generated MD5 code. |
| QUERY_SQL | longtext | NO | Actual SQL statements |
| PLAN_ID | bigint(20) | NO | Execution Plan ID |
| AFFECTED_ROWS | bigint(20) | NO | Affected Rows |
| RETURN_ROWS | bigint(20) | NO | Number of rows returned |
| PARTITION_CNT | bigint(20) | NO | Number of partitions involved in the request |
| RET_CODE | bigint(20) | NO | Execution result return code:
For more information about error codes, see Overview of error messages. |
| QC_ID | bigint(20) unsigned | NO | Scheduler ID in parallel execution scenarios |
| DFO_ID | bigint(20) | NO | ID of the current subplan in parallel execution scenarios |
| SQC_ID | bigint(20) | NO | Local coordinator ID in parallel execution scenarios |
| WORKER_ID | bigint(20) | NO | Work Thread ID in Parallel Execution Scenarios |
| EVENT | varchar(64) | YES | Longest Waiting Event Name |
| P1TEXT | varchar(64) | YES | Wait for Event Parameter 1 |
| P1 | bigint(20) unsigned | YES | Value of Parameter 1 for the Wait Event |
| P2TEXT | varchar(64) | YES | Wait for Event Parameter 2 |
| P2 | bigint(20) unsigned | YES | Value of Parameter 2 for the Wait Event |
| P3TEXT | varchar(64) | YES | Wait for Event Parameter 3 |
| P3 | bigint(20) unsigned | YES | Value of Parameter 3 for Waiting for Events |
| LEVEL | bigint(20) | YES | Level of the waiting event |
| WAIT_CLASS_ID | bigint(20) | YES | Class ID of the waiting event |
| WAIT_CLASS# | bigint(20) | YES | Index of the class to which the event belongs |
| WAIT_CLASS | varchar(64) | YES | Class name of the event to be waited for |
| STATE | varchar(19) | YES | Status of the Waiting Event |
| WAIT_TIME_MICRO | bigint(20) | YES | The time waited for by this event, in microseconds. |
| TOTAL_WAIT_TIME_MICRO | bigint(20) | YES | Total wait time for the entire execution process, in microseconds |
| TOTAL_WAITS | bigint(20) | YES | Total Number of Waitings During Execution |
| RPC_COUNT | bigint(20) | YES | Number of RPCs Sent |
| PLAN_TYPE | bigint(20) | NO | Execution plan type:
|
| IS_INNER_SQL | tinyint(4) | NO | Whether it is an internal SQL request |
| IS_EXECUTOR_RPC | tinyint(4) | NO | Whether the current request is an RPC request |
| IS_HIT_PLAN | tinyint(4) | NO | Whether the plan cache was hit |
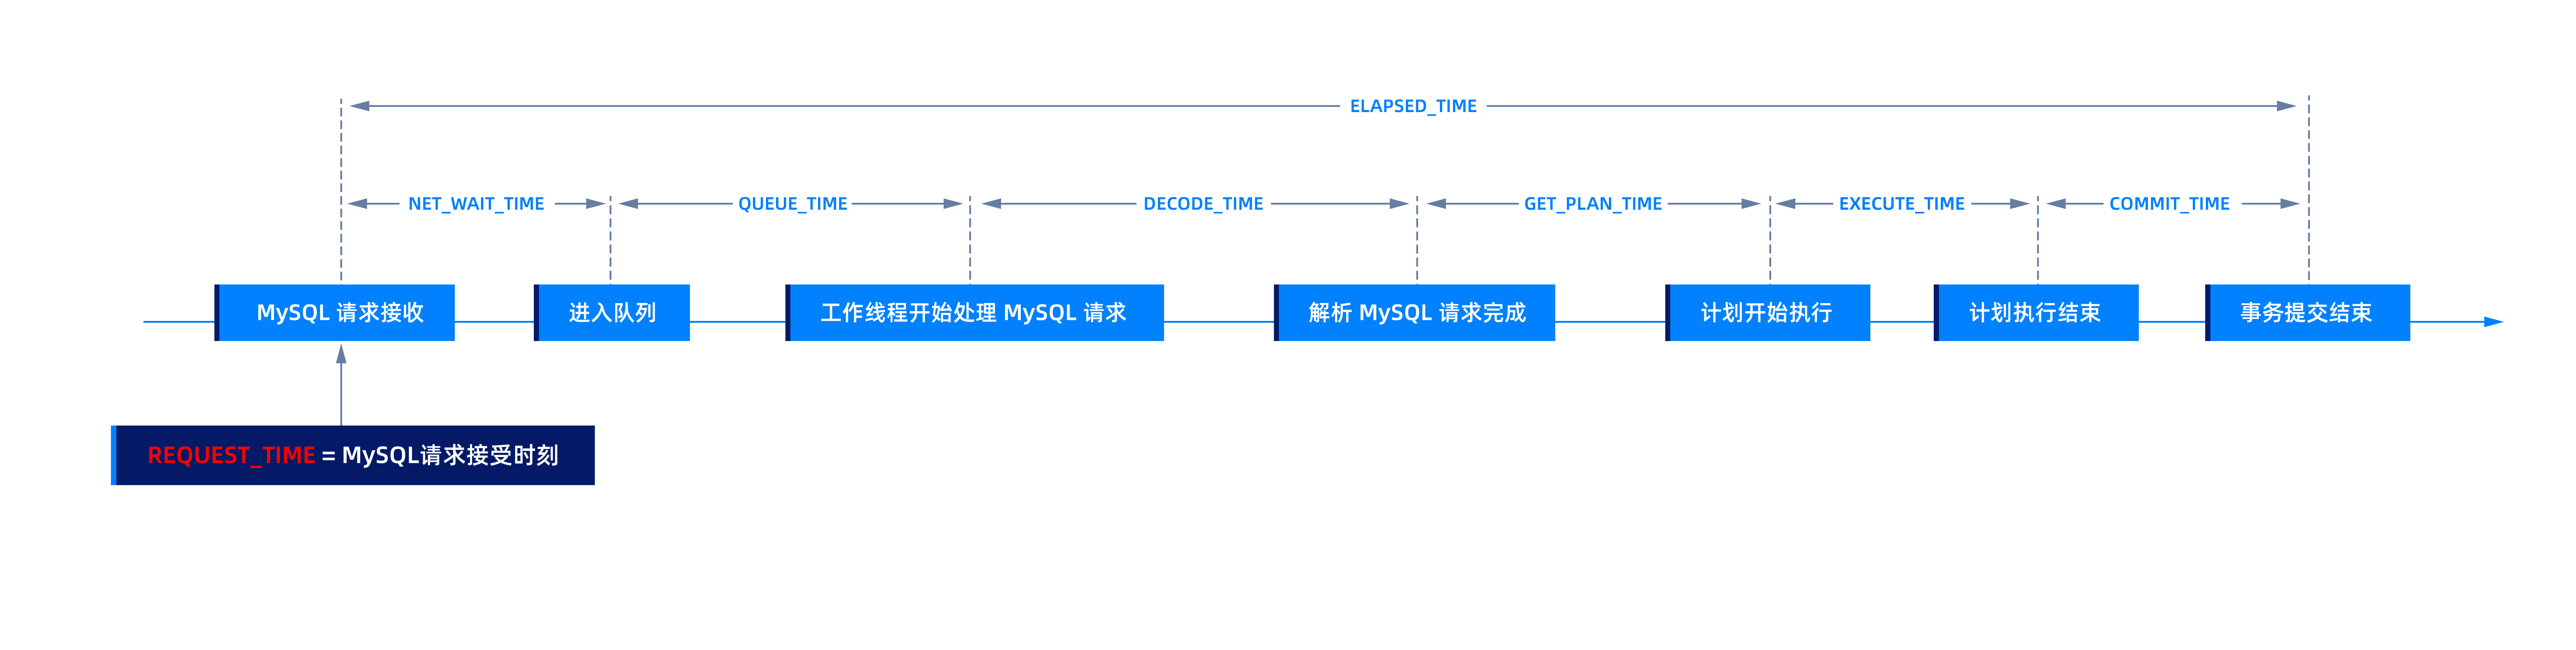
| REQUEST_TIME | bigint(20) | NO | Start time, in microseconds |
| ELAPSED_TIME | bigint(20) | NO | Total time consumed from request reception to execution completion, in microseconds |
| NET_TIME | bigint(20) | NO | Time from sending an RPC to receiving a response, in microseconds |
| NET_WAIT_TIME | bigint(20) | NO | Time elapsed from when a request is received until it enters the queue, in microseconds. |
| QUEUE_TIME | bigint(20) | NO | Waiting time of the request in the queue, in microseconds |
| DECODE_TIME | bigint(20) | NO | Time taken for decoding after dequeuing, in microseconds |
| GET_PLAN_TIME | bigint(20) | NO | Time taken from process start to plan acquisition, in microseconds |
| EXECUTE_TIME | bigint(20) | NO | Time consumed in plan execution, in microseconds |
| APPLICATION_WAIT_TIME | bigint(20) unsigned | NO | Total Time of All Application-Type Events, Unit: Microseconds |
| CONCURRENCY_WAIT_TIME | bigint(20) unsigned | NO | Total time for all concurrency events, in microseconds |
| USER_IO_WAIT_TIME | bigint(20) unsigned | NO | Total Time of All User-I/O Events, Unit: microseconds |
| SCHEDULE_TIME | bigint(20) unsigned | NO | Time of all Schedule-type events, in microseconds. |
| ROW_CACHE_HIT | bigint(20) | NO | Row Cache Hits |
| BLOOM_FILTER_CACHE_HIT | bigint(20) | NO | Number of Bloom Filter Cache Hits |
| BLOCK_CACHE_HIT | bigint(20) | NO | Block Cache Hits |
| DISK_READS | bigint(20) | NO | Physical Reads |
| RETRY_CNT | bigint(20) | NO | Retry Count |
| TABLE_SCAN | tinyint(4) | NO | Determine whether the request involves a full table scan |
| CONSISTENCY_LEVEL | bigint(20) | NO | Consistency level. Valid values:
|
| MEMSTORE_READ_ROW_COUNT | bigint(20) | YES | Number of rows read from the MemStore before filtering |
| SSSTORE_READ_ROW_COUNT | bigint(20) | YES | Number of rows in major SSTables, minor SSTables, and mini SSTables read from compressed and non-compressed paths |
| DATA_BLOCK_READ_CNT | bigint(20) | NO | Number of Microblocks of Access Data |
| DATA_BLOCK_CACHE_HIT | bigint(20) | NO | Number of Data Microblock Caches Hit |
| INDEX_BLOCK_READ_CNT | bigint(20) | NO | Number of Intermediate Microblocks Accessed |
| INDEX_BLOCK_CACHE_HIT | bigint(20) | NO | Number of Microblock Caches Hit in Middle Layer |
| BLOCKSCAN_BLOCK_CNT | bigint(20) | YES | Number of Microblocks Opened in the Pushdown Path |
| BLOCKSCAN_ROW_CNT | bigint(20) | YES | Total rows within the range of microblocks opened under the pushdown path |
| PUSHDOWN_STORAGE_FILTER_ROW_CNT | bigint(20) | YES | Total Rows Filtered by Pushdown/Non-Pushdown Filters |
| REQUEST_MEMORY_USED | bigint(20) | NO | Memory Consumed by This Request |
| EXPECTED_WORKER_COUNT | bigint(20) | NO | Expected Number of Worker Threads |
| USED_WORKER_COUNT | bigint(20) | NO | Number of Worker Threads Actually Used |
| SCHED_INFO | varchar(16384) | YES | Request Scheduling Information |
| FUSE_ROW_CACHE_HIT | bigint(20) | NO | This field is not supported. The default value is NULL. |
| PS_CLIENT_STMT_ID | bigint(20) | NO | This field records the client prepare ID corresponding to the request:
|
| PS_INNER_STMT_ID | bigint(20) | NO | This field records the internal Prepare ID corresponding to the request:
|
| TX_ID | bigint(20) | NO | Transaction ID of the Request |
| SNAPSHOT_VERSION | bigint(20) | NO | Read snapshot version used by SQL statements |
| REQUEST_TYPE | bigint(20) | NO | Type of the request. Valid values:
|
| IS_BATCHED_MULTI_STMT | tinyint(4) | NO | Whether to Optimize Batch MultiStmt |
| OB_TRACE_INFO | varchar(4096) | NO | User-Set Trace Information |
| PLAN_HASH | bigint(20) unsigned | NO | Hash value of the execution plan |
| LOCK_FOR_READ_TIME | bigint(20) | NO | Time spent waiting for locks during data reading, in microseconds |
| PARAMS_VALUE | longtext | NO | Parameter Value Bound to PS |
| RULE_NAME | varchar(256) | NO | Rule Name |
| PARTITION_HIT | tinyint(4) | NO |
|
| TX_INTERNAL_ROUTING | bigint(20) | NO | Indicates whether the SQL statement has undergone internal routing:
|
| TX_STATE_VERSION | bigint(20) unsigned | NO | Represents the transaction status version of an SQL statement. |
| FLT_TRACE_ID | varchar(1024) | NO | Indicates that this record is for end-to-end tracing of the trace. If this field is empty, it indicates that the transaction is not monitored by end-to-end tracing. This field is a UUID, which is different from a trace. Its representation is similar to: 000600d6-a5de-038c-6c80-df07e4e79149 |
| PL_TRACE_ID | varchar(128) | NO | Trace ID of the outermost PL in the current SQL statement. This value is NULL if no outer PL exists. |
| PLSQL_EXEC_TIME | bigint(20) | NO | Execution time of PL statements (excluding SQL execution time), in microseconds |
| FORMAT_SQL_ID | varchar(32) | NO | Represents the MD5 value generated by formatting the SQL text of this record. |
| STMT_TYPE | varchar(128) | YES | DML operations return the following information as needed:
|
| TOTAL_MEMSTORE_READ_ROW_COUNT | bigint(20) | NO | Total number of rows read from the MemStore during the entire workflow (this variable is displayed only in the thread that executes the query_text). |
| TOTAL_SSSTORE_READ_ROW_COUNT | bigint(20) | NO | Total number of rows read from SSSTORE during the entire process (This variable is displayed only in the thread that executes query_text.) |
| PROXY_USER | varchar(128) | NO |
|
| SEQ_NUM | bigint(20) | NO | Statement Sequence Number in a Transaction |
| NETWORK_WAIT_TIME | bigint(20) unsigned | YES | Total time for all network events, in microseconds. |
| PLSQL_COMPILE_TIME | bigint(20) | NO | PL Compilation Time. |
| INSERT_DUPLICATE_ROW_COUNT | bigint(20) | YES | Record insertup or replace into The number of duplicate rows during the period. |
| USER_CLIENT_PORT | bigint(20) | NO | Displays the client port number.
NoteThis field is NULL by default. |
| TRANS_STATUS | varchar(256) | NO | Whether a transaction is explicitly started, implicitly started, or not started at all.
NoteThe default value of this field is NULL. |
| TX_TABLE_READ_CNT | bigint(20) | YES | Number of times the transaction status table is queried. |
| OUTROW_LOB_CNT | bigint(20) | YES | The number of out-of-row LOB columns read during the query. |
| COMMIT_TIME | bigint(20) | NO | Indicates the commit time consumed in triggering the commit SQL statement during a transaction. If the SQL statement does not trigger a commit, the default value is 0. |
| OBJECT_STORAGE_READS | bigint(20) | YES | Indicates the number of times the object storage is read. |
| PARENT_TRACE_ID | varchar(128) | YES | Parent SQL of the Current SQL trace_id. |
Important Event Intervals
The following figure describes the relationships among the important columns in this view:
Sample query
Query the statistics of each SQL request on all OBServer nodes, such as the source and execution status.
obclient [oceanbase]> SELECT * FROM oceanbase.GV$OB_SQL_AUDIT LIMIT 1\G
The query result is as follows:
*************************** 1. row ***************************
                         SVR_IP: 172.xx.xxx.xxx
                       SVR_PORT: 2882
                     REQUEST_ID: 1620721
                    SQL_EXEC_ID: 18074403
                       TRACE_ID: xxxxxxx-xxxxxxxxx-0-0
                            SID: 3221731092
                      CLIENT_IP: 0.0.0.0
                    CLIENT_PORT: 0
                      TENANT_ID: 1002
                    TENANT_NAME: sys
            EFFECTIVE_TENANT_ID: 1002
                        USER_ID: 200001
                      USER_NAME: root
                     USER_GROUP: 0
                 USER_CLIENT_IP: 0.0.0.0
                          DB_ID: 201001
                        DB_NAME: oceanbase
                         SQL_ID: 251EBD3394EA3971C8F288E5D3F784F6
                      QUERY_SQL:
                        PLAN_ID: 266
                  AFFECTED_ROWS: 0
                    RETURN_ROWS: 0
                  PARTITION_CNT: 1
                       RET_CODE: 0
                          QC_ID: 0
                         DFO_ID: 0
                         SQC_ID: 0
                      WORKER_ID: 0
                          EVENT: exec inner sql wait
                         P1TEXT: wait inner sql class
                             P1: 0
                         P2TEXT: inner session id
                             P2: 4611686018441369514
                         P3TEXT:
                             P3: 0
                          LEVEL: 0
                  WAIT_CLASS_ID: 100
                    WAIT_CLASS#: 0
                     WAIT_CLASS: OTHER
                          STATE: WAITED SHORT TIME
                WAIT_TIME_MICRO: 52
          TOTAL_WAIT_TIME_MICRO: 52
                    TOTAL_WAITS: 1
                      RPC_COUNT: 0
                      PLAN_TYPE: 1
                   IS_INNER_SQL: 1
                IS_EXECUTOR_RPC: 0
                    IS_HIT_PLAN: 1
                   REQUEST_TIME: 1749808481646912
                   ELAPSED_TIME: 158
                       NET_TIME: 0
                  NET_WAIT_TIME: 0
                     QUEUE_TIME: 0
                    DECODE_TIME: 0
                  GET_PLAN_TIME: 105
                   EXECUTE_TIME: 53
          APPLICATION_WAIT_TIME: 0
          CONCURRENCY_WAIT_TIME: 0
              USER_IO_WAIT_TIME: 0
                  SCHEDULE_TIME: 0
                  ROW_CACHE_HIT: 0
         BLOOM_FILTER_CACHE_HIT: 0
                BLOCK_CACHE_HIT: 0
                     DISK_READS: 0
                      RETRY_CNT: 0
                     TABLE_SCAN: 1
              CONSISTENCY_LEVEL: 3
        MEMSTORE_READ_ROW_COUNT: 0
         SSSTORE_READ_ROW_COUNT: 0
            DATA_BLOCK_READ_CNT: 0
           DATA_BLOCK_CACHE_HIT: 0
           INDEX_BLOCK_READ_CNT: 0
          INDEX_BLOCK_CACHE_HIT: 0
            BLOCKSCAN_BLOCK_CNT: 0
              BLOCKSCAN_ROW_CNT: 0
PUSHDOWN_STORAGE_FILTER_ROW_CNT: 0
            REQUEST_MEMORY_USED: 2145536
          EXPECTED_WORKER_COUNT: 0
              USED_WORKER_COUNT: 0
                     SCHED_INFO: NULL
             FUSE_ROW_CACHE_HIT: 0
              PS_CLIENT_STMT_ID: -1
               PS_INNER_STMT_ID: -1
                          TX_ID: 0
               SNAPSHOT_VERSION: 1749808481453717000
                   REQUEST_TYPE: 1
          IS_BATCHED_MULTI_STMT: 0
                  OB_TRACE_INFO: NULL
                      PLAN_HASH: 4897367372082854791
             LOCK_FOR_READ_TIME: 0
                   PARAMS_VALUE:
                      RULE_NAME:
                  PARTITION_HIT: 1
            TX_INTERNAL_ROUTING: 0
               TX_STATE_VERSION: 0
                   FLT_TRACE_ID:
                    PL_TRACE_ID: NULL
                PLSQL_EXEC_TIME: 0
                  FORMAT_SQL_ID: 35E22E2A6C2F463C8564C82B0E202492
                      STMT_TYPE: SELECT
  TOTAL_MEMSTORE_READ_ROW_COUNT: 0
   TOTAL_SSSTORE_READ_ROW_COUNT: 0
                     PROXY_USER:
                        SEQ_NUM: 1749808481602246
              NETWORK_WAIT_TIME: 0
             PLSQL_COMPILE_TIME: 0
     INSERT_DUPLICATE_ROW_COUNT: 0
               USER_CLIENT_PORT: 0
                   TRANS_STATUS: Transaction not opened
                    CCL_RULE_ID: 0
                 CCL_MATCH_TIME: 0
              TX_TABLE_READ_CNT: 0
                 OUTROW_LOB_CNT: 0
                    COMMIT_TIME: 0
           OBJECT_STORAGE_READS: 0
References
- V$OB_SQL_AUDIT
- End-to-end tracing