OceanBase
English日本語简体中文
Docs Home
Products
Integrations
Release Notes

Databases

OceanBase DatabaseOceanBase Cloud OceanBase Best Practices

Tools

OceanBase Cloud PlatformOceanBase Migration ServiceOceanBase Developer CenterOceanBase Migration AssessmentOceanBase Admin ToolOceanBase Loader and DumperOceanBase DeployerKubernetes operator for OceanBaseOceanBase Diagnostic Tool OceanBase Binlog Service

Connectors and Middleware

OceanBase Database Proxy OceanBase Connector/C OceanBase Connector/J OceanBase Connector/ODBC OceanBase Connector/NETOceanBase Command-Line Client

Databases

OceanBase DatabaseOceanBase Cloud OceanBase Best Practices

Connectors and Middleware

OceanBase Database Proxy OceanBase Connector/C OceanBase Connector/J OceanBase Connector/ODBC OceanBase Connector/NETOceanBase Command-Line Client

Tools

OceanBase Cloud PlatformOceanBase Migration ServiceOceanBase Developer CenterOceanBase Migration AssessmentOceanBase Admin ToolOceanBase Loader and DumperOceanBase DeployerKubernetes operator for OceanBaseOceanBase Diagnostic Tool OceanBase Binlog Service
OceanBase DatabaseOceanBase Cloud ToolsConnectors and MiddlewareLifecycle Support Policy

OceanBase Developer Center

V4.5.0
  • Topics Overview
  • Overview
    • What is ODC?
    • Features
    • Architecture
    • Limitations
    • ODC console
  • Quick Start
    • Client ODC
      • Overview
      • Install Client ODC
      • Use Client ODC
    • Web ODC
      • Overview
      • Deploy Web ODC
      • Use Web ODC
  • Data Source Management
    • Create a data source
    • Data sources and project collaboration
    • Database O&M
      • Session management
      • Global variable management
      • Recycle bin management
  • SQL Development
    • Edit and execute SQL statements
    • Perform PL compilation and debugging
    • Use the command-line window
    • Edit and export the result set
    • Execution Analysis
    • Generate test data
    • System settings
    • Intelligent SQL development
    • Common features
    • Database objects
      • Table objects
        • Overview
        • Create a table
      • View objects
        • Overview
        • Create a view
        • Manage views
      • Materialized view objects
        • Overview
        • Create a materialized view
        • Manage materialized views
      • Function objects
        • Overview
        • Create a function
        • Manage functions
      • Stored procedure objects
        • Overview
        • Create a stored procedure
        • Manage stored procedures
      • Sequence objects
        • Overview
        • Create a sequence
        • Manage sequences
      • Package objects
        • Overview
        • Create a program package
        • Manage program packages
      • Trigger objects
        • Overview
        • Create a trigger
        • Manage triggers
      • Type objects
        • Overview
        • Create a type
        • Manage types
      • Synonym objects
        • Overview
        • Create a synonym
        • Manage synonyms
      • External resource objects
        • External resources
        • Create an external resource
        • Manage external resources
  • Database Change Risk Management
    • Project collaborative management
      • Project management
      • Manage databases
      • Manage logical databases
      • Add object storage files
      • Manage project members
      • Desensitize data
      • Notification management
        • Overview
        • View notification records
        • Manage notification channels
          • Create a notification channel
          • View, edit, and delete a notification channel
          • Configure a custom channel
        • Manage notification rules
    • Manage user permissions
      • Users and roles
      • Automatic authorization
      • Apply for project permissions
      • Apply for database permissions
      • Apply table/view permissions
    • Security standards
      • Environment configuration
        • SQL check specifications
        • SQL window specification
      • Risk Management
        • Overview
        • Manage risk identification rules
        • Manage approval processes
      • Desensitization algorithms
      • Operation audit
  • Ticket Management
    • Import schemas and data
    • Export schemas and data
    • Database change management
    • Manage changes to logical databases
    • Batch database change management
    • Online schema changes
    • Synchronize shadow tables
    • Schema comparison
  • Data Lifecycle Management
    • Data archiving
    • Data cleanup
    • Manage partitioning plans
      • Manage partitioning plans
      • Set partitioning strategies
      • Examples of partitioning strategies
    • SQL Plan
  • System Integration
    • Login integration
    • Approval integration
    • SQL approval integration
    • Bastion host integration
    • Integrate with LLMs
  • Deployment Guide
    • Deployment overview
    • Preparations before deployment
    • Deploy ODC in single-node mode
    • Deploy ODC in high-availability mode
    • Deployment verification
  • Upgrade Guide
    • Upgrade Overview
    • Preparations for upgrade
    • Update single-node ODC
    • Update high-avaliability ODC
    • Upgrade verification
    • Rollback after upgrade failed
  • Best Practices
    • Tips for SQL development
    • Explore ODC team workspaces
    • Understanding real-time SQL diagnostics for OceanBase AP
    • OceanBase historical database solutions
    • ODC SQL check for automatic identification of high-risk operations
    • Integration with ODC enterprise-level account system
    • Manage and modify sharded databases and tables via ODC
    • Data masking and control practices
    • Enterprise-level control and collaboration: Safeguard every database change
  • Troubleshooting
    • ODC troubleshooting process
    • Collect message
      • View the runtime environment and version information
      • View web ODC logs
      • View client ODC logs
      • View end-to-end ODC-related logs
      • View ODC MetaDB data
      • Query the index status in OceanBase Database V4.x
      • Query the index status in OceanBase Database V1.4.x to V3.2.x
      • Collect JVM runtime information
      • Use tcpdump to capture packets
    • FAQ
      • Installation of client ODC
      • Web ODC deployment and startup
      • Connection Information
      • Command-line window
      • DDL statement display
  • Release Notes
    • V4.5
      • ODC V4.5.0
    • V4.4
      • ODC V4.4.0
      • ODC V4.4.1
      • ODC V4.4.2
      • ODC V4.4.3
    • V4.3
      • ODC V4.3.4
      • ODC V4.3.3
      • ODC V4.3.2
      • ODC V4.3.1
      • ODC V4.3.0
    • V4.2
      • ODC V4.2.4
      • ODC V4.2.3
      • ODC V4.2.2
      • ODC V4.2.1
      • ODC V4.2.0
    • V4.1
      • ODC V4.1.3
      • ODC V4.1.2
      • ODC V4.1.1
      • ODC V4.1.0
    • V4.0
      • ODC V4.0.2
      • ODC V4.0.0
    • V3.4
      • ODC V3.4.0
    • V3.3
      • ODC V3.3.3
      • ODC V3.3.2
      • ODC V3.3.1
      • ODC V3.3.0
    • V3.2
      • ODC V3.2.3
      • ODC V3.2.2
      • ODC V3.2.1
      • ODC V3.2.0

Download PDF

Document Feedback
  1. Documentation Center
  2. OceanBase Developer Center
  3. V4.5.0

Execution Analysis

Last Updated:2026-09-03 09:11:30

Background information
Execution plan
Execution record
Accessing the execution profile
Execution analysis
Execution Plan
End-to-End Diagnostics
Database Time Consumption
References

Background information

The ODC SQL window provides a user interface for processing data. In the SQL window, you can perform system evaluation on SQL statements, view execution records, and obtain end-to-end execution time information.

This document uses the employee table as an example to describe how to perform system evaluation on a query SQL statement.

Execution plan

  1. In the SQL window, edit the SQL statement to query the data inserted into the employee table.

    SELECT `emp_no`, `birthday`, `name`, `time`, `test_col`, `status`, `age`, `state` FROM `employee`;
    
  2. As shown in the figure above, select the SQL statement and click the execution plan icon. The system estimates the execution data (the result of the EXPLAIN PLAN operation) before executing the SQL statement. The displayed execution data may differ slightly from the actual data after statement execution.

  3. On the Plan Details page, click Text View to switch to the formatted display page.

Execution record

Note

  • For versions earlier than OceanBase Database V4.2.4, when executing an SQL statement, you can view the basic execution information, time statistics, I/O statistics, executed SQL statement, plan statistics, and outline through Execution Records on the result set tab.

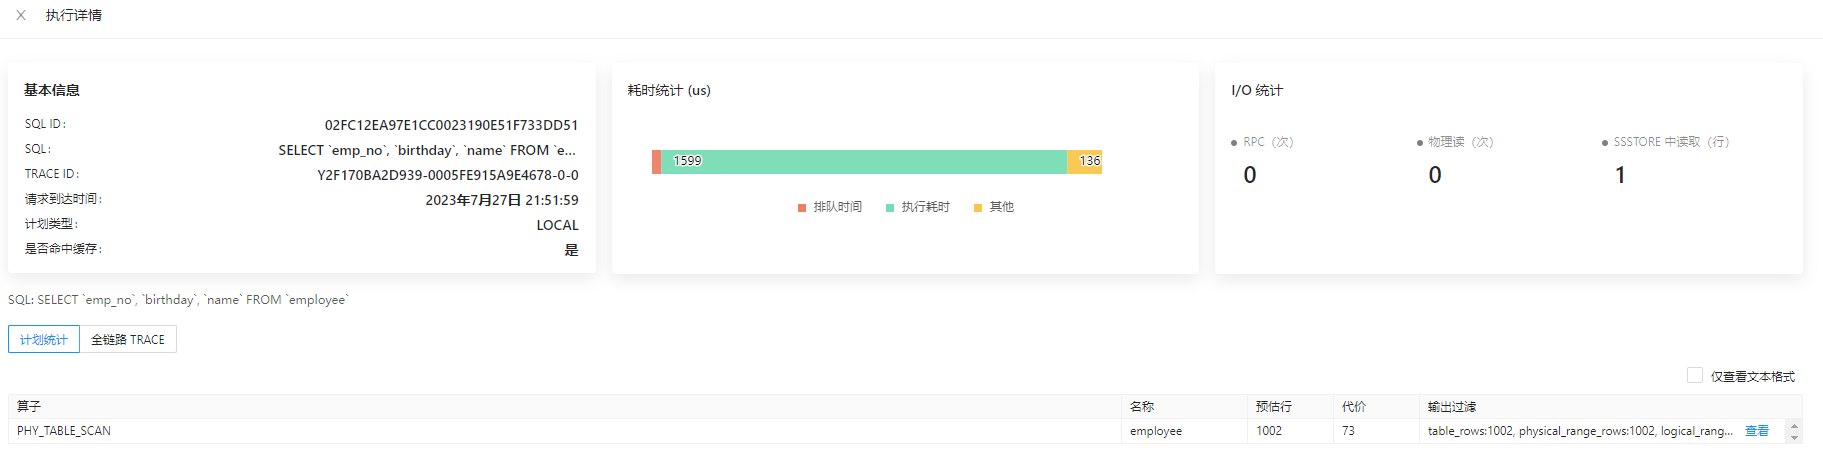
  • For versions OceanBase V4.2.4 and later but earlier than OceanBase V4.3.0, or for versions OceanBase V4.3.3.1 and later, when you execute queries/inserts/updates/deletes/retrieval operations on database data, you can use Execution Profile to query the execution analysis of SQL statements in real time. This allows you to quickly view SQL execution records and identify performance bottlenecks.

Accessing the execution profile

  • Method 1: While executing an SQL statement in the SQL window, you can click View Execution Profile on the Logs tab during execution.

    Notice

    If the execution time of the SQL statement is less than 1 second, the entry for accessing the execution profile may not be displayed on the Log tab.

  • Method 2: After the SQL statement execution is complete, you can click the execution profile icon in the execution results.

  • Method 3: After the SQL statement execution is complete, you can click the TRACE ID on the Execution Records tab to enter the execution profile interface.

Execution analysis

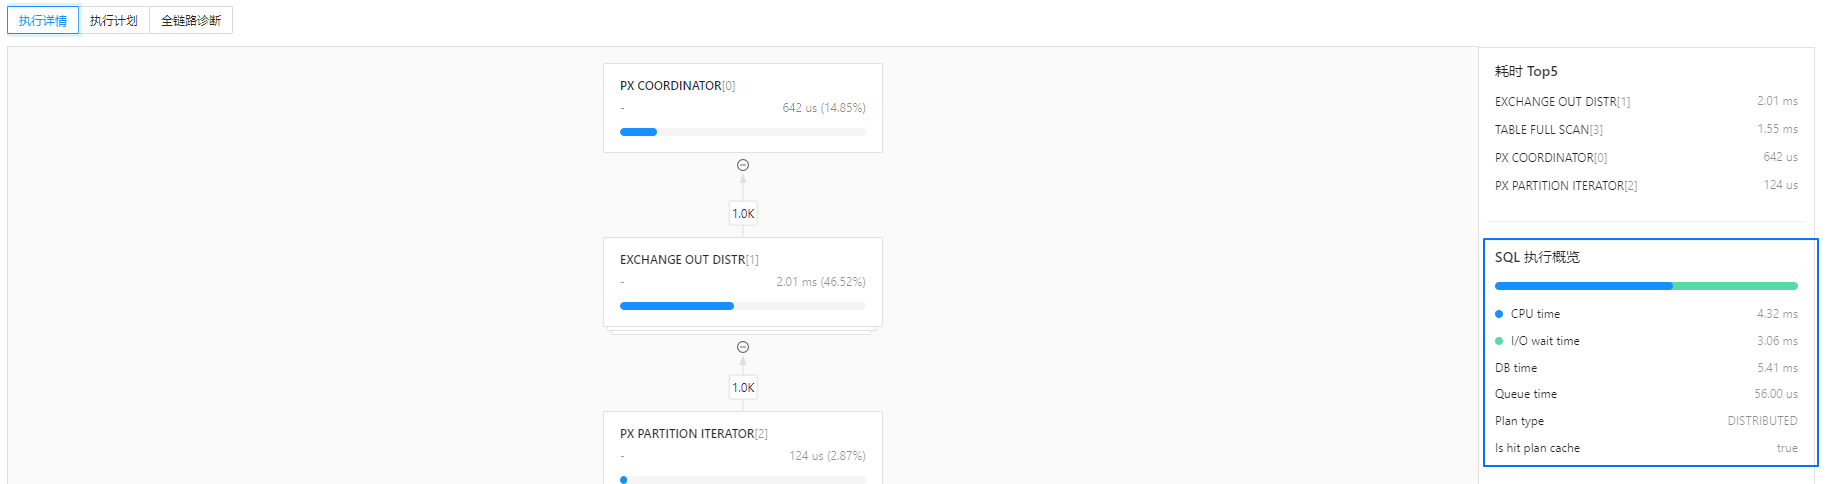
Execution Details, also known as the execution profile, provides visualization and data collection for SQL execution plans. It supports real-time viewing of operator execution status, time details, I/O, and runtime data, and summarizes and ranks the overall execution time.

Through execution profiles, you can:

  • View the actual execution plan of OceanBase in a graphical format, making it easier to understand operator execution order and connection relationships.

  • Quickly identify execution bottlenecks through the execution overview, real-time I/O statistics, and the top 5 time-consuming operations. ODC sorts these based on CPU time.

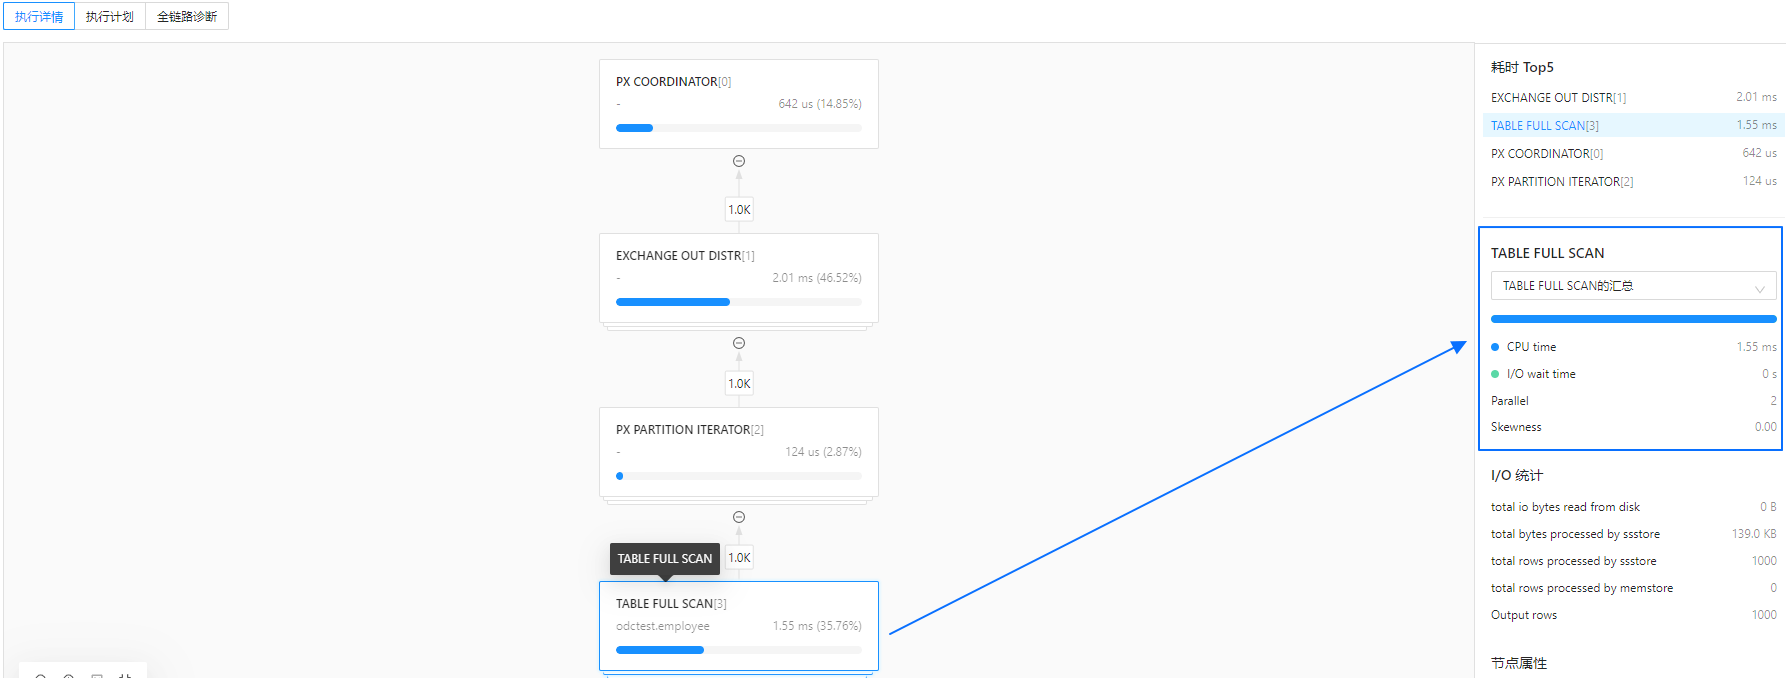
  • Query the execution status, time, and output row count of operators in real time. By clicking an operator node, you can view its attributes, timing details, as well as I/O and other runtime data on the right side.

  • Supports analyzing single-machine execution plans and distributed execution plans. Parallel execution operators can be sorted by DB time, I/O memory, and output row count to quickly locate data skew.

SQL Execution Overview

Type
Parameter description
SQL Execution Overview
  • CPU time: The sum of CPU time consumed by all operators.
  • I/O wait time: The sum of I/O wait time of all operators.
  • DB time: The time consumed for plan execution.
  • Queue time: The waiting time of the request in the queue.
  • Plan type: Indicates the execution plan type, which can be LOCAL, REMOTE, or DISTRIBUTED.
  • Is hit plan cache: Indicates whether the plan cache was hit.
Operator Execution Overview
  • CPU time: The total CPU time consumed by the current operator. For a parallel operator, this value is the sum of the times consumed by all child threads.
  • I/O wait time: The I/O wait time of the current operator, including disk I/O and network time. For a parallel operator, this value is the sum of the times consumed by all child threads.
  • Parallel: The degree of parallelism, that is, the actual number of threads running in parallel for the current operator.
  • Skewness: Skewness. A higher value indicates a greater disparity in the output times among child threads, suggesting that a particular execution node or thread may be slowing down the entire operator.
  • Process name: Thread ID. You can use this value to find the IP address and port of the corresponding node.
  • Change time: The output time of the current thread, which is the time difference between outputting the first row of data and outputting the last row of data.

I/O Statistics

Type
Parameter description
Operator I/O Statistics
  • Output rows: The number of rows output.
  • Start times: The number of times the operator has been rescanned. For example, the right child node of a nested-loop join operator may be scanned multiple times.
  • Max memory: The upper limit of workarea memory occupied by the operator during runtime.
  • Max disk: The maximum disk dump space occupied by the operator during runtime.

Node Attributes

Node attributes consist of the operator's output information and runtime data (Other statistics).

For more node output information, refer to the official OceanBase documentation, for example, Attributes of a Table Scan operator.

Runtime data represents different meanings on different operators and serves as important monitoring metrics. For such metrics, refer to the V$SQL_MONITOR_STATNAME view.

Execution Plan

Unlike the Execution Plan in the SQL window, the execution plan in the Execution Profile displays the actual execution plan, thus including Actual Rows and Actual Cost. ODC obtains the current plan using the DBMS_XPLAN package.

You can also click Text View in the upper-right corner to switch views and query more comprehensive plan information, facilitating further SQL tuning.

End-to-End Diagnostics

When the OceanBase version is higher than 4.2.0 (if connecting via OBProxy, the version should be OBProxy V4.2.0 or later), ODC supports viewing visualized end-to-end diagnostic information for SQL. For more information, see Overview of OceanBase End-to-End Tracing.

For OceanBase's end-to-end diagnostic data, ODC provides two visualization views: Trace View and List View.

The Trace View displays the overall SQL execution timeline, supports expanding and collapsing nodes, and supports search highlighting. Hovering the mouse over the timeline allows you to view the execution node, start and end times, and detailed data for the current node.

Click Table View to switch views, allowing filtering and sorting of Spans across various dimensions.

ODC supports exporting end-to-end diagnostic data in JSON format, which is compatible with the OpenTracing protocol. You can import it into Jaeger for further analysis.

Database Time Consumption

On the Execution Logs tab, you can hover over the tooltip icon next to the DB Time information. The popup message displays the end-to-end time consumption of the SQL execution, allowing you to verify whether the time spent in each stage matches the actual execution.

References

  • SQL editing and execution

  • PL compilation and debugging

  • Command-line window

  • Result editing and exporting

  • Generate test data

  • Database change management

  • Partition management

  • Shadow table synchronization

  • Lock-free schema change

Previous topic

Edit and export the result set
Last

Next topic

Generate test data
Next
on this page
Background information
Execution plan
Execution record
Accessing the execution profile
Execution analysis
Execution Plan
End-to-End Diagnostics
Database Time Consumption
References