
High host CPU usage is a common issue in database O&M, often triggered by business SQL. CPU resource exhaustion can lead to prolonged business response times and even service unavailability. Therefore, it is crucial to quickly identify and resolve the issue. This topic explains how to quickly confirm the issue and pinpoint critical SQL statements when business SQL causes high host CPU usage in a public cloud environment.
Verify the issue
You can confirm whether a host has high CPU usage in the following ways:
Configure alerts
On the OceanBase Cloud console, configure the OceanBase Node CPU Usage alert to receive notifications when a host (OceanBase node) has high CPU usage. For more information, see Alert management.
View host monitoring data
On the OceanBase Cloud console, view the CPU Usage monitoring data for each host. If the CPU usage remains around 95%, it indicates that the CPU resources are exhausted. For more information, see Monitor host performance in a cluster.
Troubleshoot the issue
High CPU usage on a host is typically caused by business SQL queries. Therefore, SQL-related issues should be prioritized during troubleshooting.
Problem analysis
Automatic analysis
The system provides root cause analysis for exceptions, automatically identifies SQL queries with excessively high CPU usage during abnormal periods, and offers optimization suggestions. For more information about how to view the root cause analysis feature, see Exception handling.
Manual analysis
For a single-tenant cluster, you can use the tenant-level Top SQL feature to identify the SQL query that consumes the most CPU resources. For a multi-tenant cluster, you can use the cluster-level Top SQL feature to quickly locate the problematic SQL query.
Procedure
Log in to the OceanBase Cloud console.
In the left-side navigation pane, click Instances.
In the instance list, find the target instance, click the instance name, and go to the instance overview page.
In the left-side navigation pane, click Diagnostics, and then select the Real-Time Diagnostics tab on the Diagnostics page.
In the Real-Time Diagnostics section, select a tenant.
For a single-tenant cluster, the system displays the current tenant by default, so you do not need to select one.
For a multi-tenant cluster, select All Tenants.
On the SQL tab, select the target node from the Node drop-down list, select the time period when the CPU usage was abnormal from the Time Range field (it is recommended to select a period that starts when the abnormality was first detected to ensure data accuracy), and click Query.
On the Top SQL tab, select CPU proportion (%) and sort the results in descending order.
Note
CPU proportion (%) indicates the percentage of the total CPU time consumed by the SQL query to the total CPU time consumed by all SQL queries. The higher the value, the more CPU resources the query consumes.
After you find the target SQL query, click the link in the SQL Text column to go to the SQL query details page, and check whether the following issues exist. If they do, take the corresponding measures:
IssueVerification methodRecommended actionPlan degradation - Check whether the target SQL query is a suspicious SQL query (for more information, see Suspicious SQL).
- View the execution plans of the target SQL query and analyze the time points of plan changes based on the historical SQL query trends.
- Refresh the plan cache of the SQL query.
- Fix the execution plan.
- Implement throttling.
Sudden increase in request volume Check whether the Total Executions of the target SQL query shows a sudden increase during the period when the CPU usage was abnormal (for more information, see Top SQL). - Comprehensively optimize the indexes.
- Implement throttling.
Performance degradation Check whether the CPU Time of the target SQL query shows an upward trend during the period when the CPU usage was abnormal (for more information, see Top SQL). - Refresh the plan cache of the SQL query.
- Comprehensively optimize the indexes.
- Implement throttling.
FAQ
1. How is CPU time calculated?
Currently, there is no metric for SQL CPU resource consumption on OBServer. OAS uses the following formula to calculate the CPU time consumed during SQL execution:
v$ob_sql_audit.execute_time + v$ob_sql_audit.get_plan_time - v$ob_sql_audit.total_wait_time_micro
Note
- execute_time: the time taken to execute the plan.
- get_plan_time: the time taken to generate the execution plan.
- total_wait_time_micro: the total time spent on all waits during execution.
For more information about the monitoring metrics, see SQL Audit.
2. Why is CPU time used instead of response time (v$ob_sql_audit.elapsed_time) for sorting?
The following figure shows the general time model for SQL execution on OBServer.
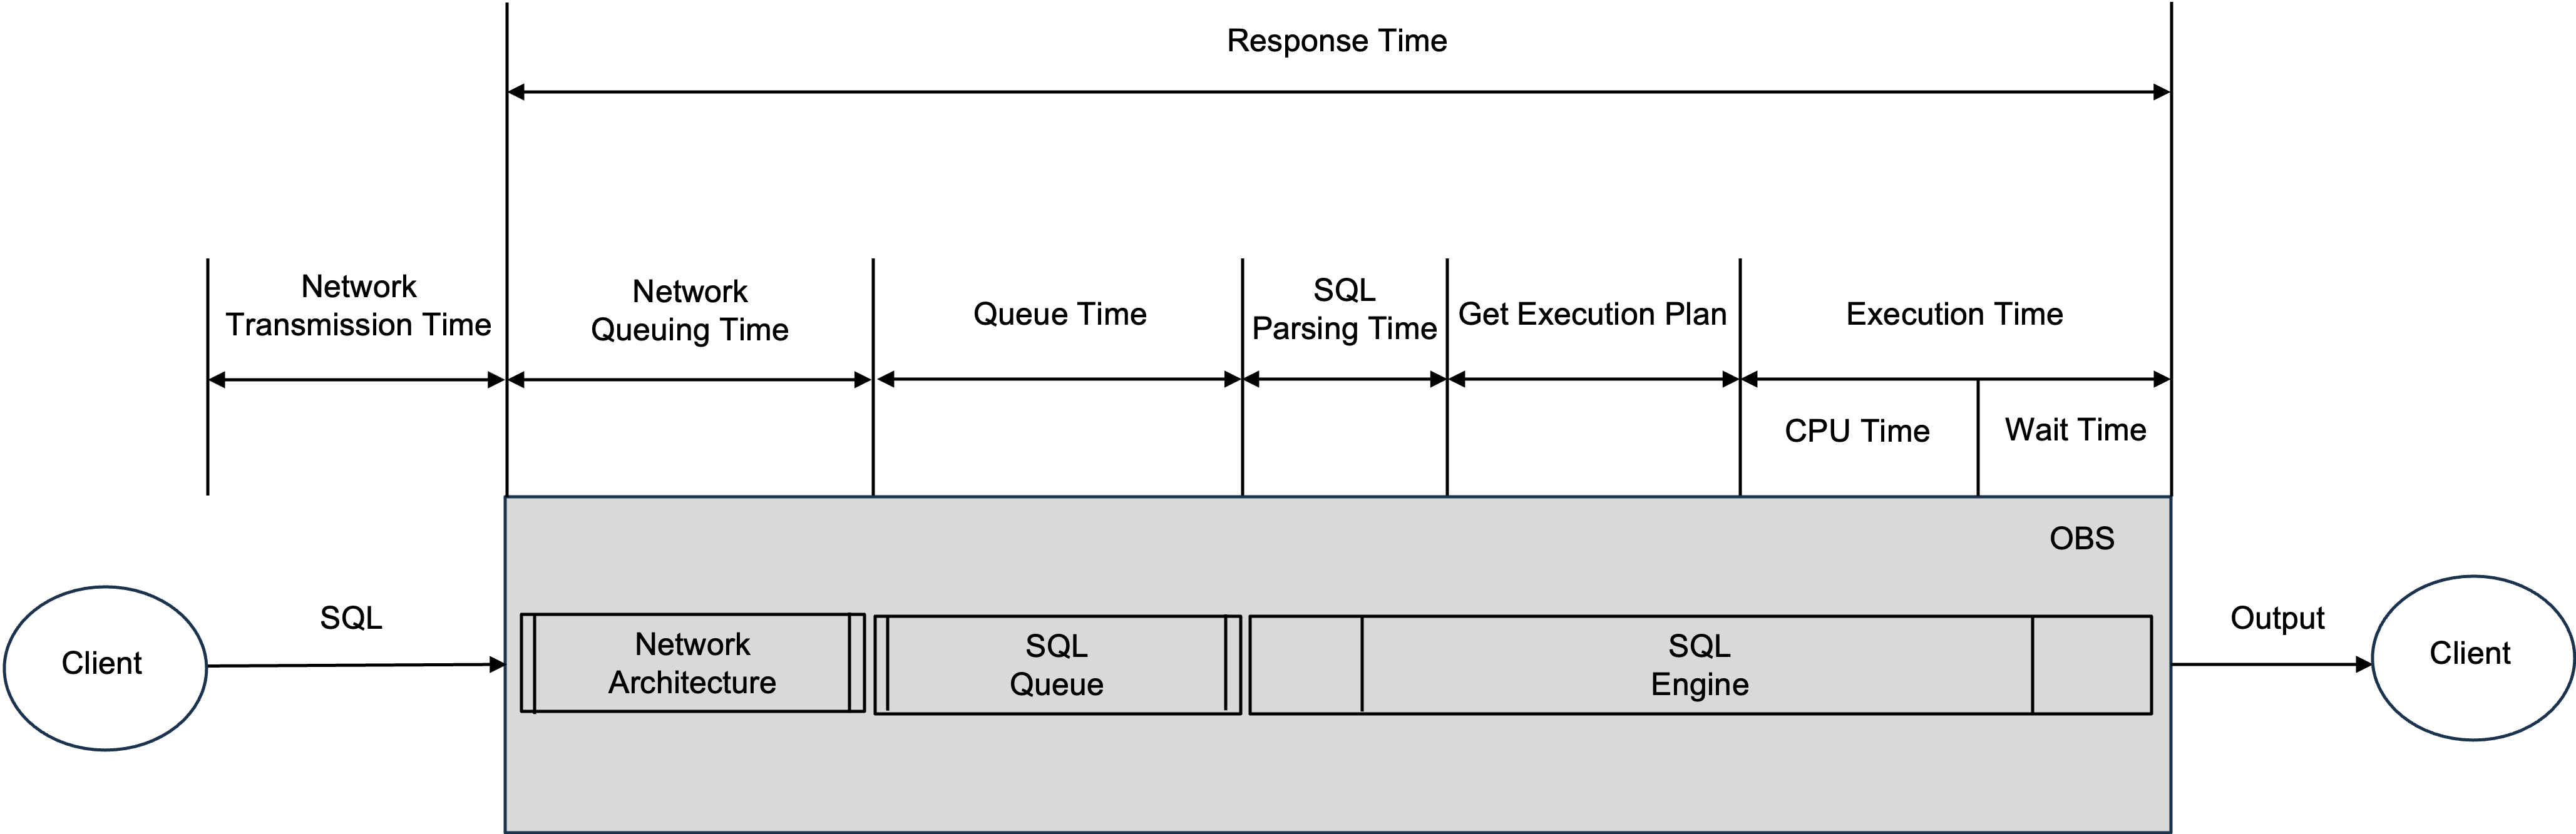
Note
- Unlike OBServer, OAS includes the time taken to obtain the execution plan in the CPU time.
- Since SQL parsing time is usually short, it is not included in the CPU time.
As shown in the figure, SQL statements wait for resources (usually idle threads) in the SQL queue before execution. During this waiting period, they consume minimal CPU resources.
When CPU utilization is high, the SQL queue can become backed up, leading to longer queue times for SQL statements. In such cases, the response time (v$ob_sql_audit.elapsed_time) may not accurately reflect the CPU resources consumed by the SQL statements.
Therefore, when CPU utilization is high, it is recommended to prioritize sorting by CPU time.