OceanBase
English日本語简体中文
Docs Home
Products
Integrations
Release Notes

Databases

OceanBase DatabaseOceanBase Cloud OceanBase Best Practices

Tools

OceanBase Cloud PlatformOceanBase Migration ServiceOceanBase Developer CenterOceanBase Migration AssessmentOceanBase Admin ToolOceanBase Loader and DumperOceanBase DeployerKubernetes operator for OceanBaseOceanBase Diagnostic Tool OceanBase Binlog Service

Connectors and Middleware

OceanBase Database Proxy OceanBase Connector/C OceanBase Connector/J OceanBase Connector/ODBC OceanBase Connector/NETOceanBase Command-Line Client

Databases

OceanBase DatabaseOceanBase Cloud OceanBase Best Practices

Connectors and Middleware

OceanBase Database Proxy OceanBase Connector/C OceanBase Connector/J OceanBase Connector/ODBC OceanBase Connector/NETOceanBase Command-Line Client

Tools

OceanBase Cloud PlatformOceanBase Migration ServiceOceanBase Developer CenterOceanBase Migration AssessmentOceanBase Admin ToolOceanBase Loader and DumperOceanBase DeployerKubernetes operator for OceanBaseOceanBase Diagnostic Tool OceanBase Binlog Service
OceanBase DatabaseOceanBase Cloud ToolsConnectors and MiddlewareLifecycle Support Policy

OceanBase Database Proxy

V4.3.6
  • What is ODP?
  • Installation and deployment
    • Overview
    • Deploy ODP by using obd
    • Deploy ODP by using OCP
    • Deploy ODP by using the CLI
    • Deployment modes
  • Basic operations
  • Configuration parameter
    • View and modify parameters
    • Parameter summary
    • Global parameters
      • automatic_match_work_thread
      • block_thread_num
      • cache_cleaner_clean_interval
      • check_tenant_locality_change
      • client_max_connections
      • client_max_memory_size
      • client_session_id_version
      • client_sock_option_flag_out
      • client_tcp_keepcnt
      • client_tcp_keepidle
      • client_tcp_keepintvl
      • client_tcp_user_timeout
      • cluster_count_high_water_mark
      • cluster_expire_time
      • config_server_refresh_interval
      • congestion_fail_window
      • congestion_failure_threshold
      • congestion_retry_interval
      • connection_diagnosis_option
      • connection_pool_mode
      • connect_observer_max_retries
      • current_local_config_version
      • default_buffer_water_mark
      • default_inactivity_timeout
      • delay_exit_time
      • delay_update_entry_interval
      • detect_server_timeout
      • digest_sql_length
      • enable_abort_conn_info
      • enable_async_log
      • enable_async_pull_location_cache
      • enable_auto_restart
      • enable_bad_route_reject
      • enable_binlog_service
      • enable_cached_server
      • enable_causal_order_read
      • enable_client_connection_lru_disconnect
      • enable_client_ip_checkout
      • enable_cluster_checkout
      • enable_compression_protocol
      • enable_congestion
      • enable_connection_diagnosis
      • enable_cpu_isolate
      • enable_cpu_topology
      • enable_crash_error_log
      • enable_cross_shard_txn
      • enable_extra_prometheus_metric
      • enable_flow_control
      • enable_full_link_trace
      • enable_full_username
      • enable_get_rslist_remote
      • enable_global_ps_cache
      • enable_index_route
      • enable_monitor_stat
      • enable_ob_protocol_v2
      • enable_obproxy_rpc_service
      • enable_partition_table_route
      • enable_performance_mode
      • enable_pl_route
      • enable_primary_zone
      • enable_prometheus
      • enable_proxy_scramble
      • enable_qa_mode
      • enable_qos
      • enable_report_session_stats
      • enable_reroute
      • enable_scan_all_request
      • enable_sequence_prefetch
      • enable_sharding
      • enable_single_leader_node_routing
      • enable_standby
      • enable_stat
      • enable_strict_kernel_release
      • enable_strict_stat_time
      • enable_sync_all_stats
      • enable_syslog_file_compress
      • enable_syslog_wf
      • enable_trace
      • enable_trace_stats
      • enable_trans_detail_stats
      • enable_transaction_internal_routing
      • enable_xa_route
      • fetch_proxy_bin_random_time
      • fetch_proxy_bin_timeout
      • flow_consumer_reenable_threshold
      • flow_event_queue_threshold
      • flow_high_water_mark
      • flow_low_water_mark
      • grpc_client_num
      • grpc_thread_num
      • hot_upgrade_exit_timeout
      • hot_upgrade_failure_retries
      • hot_upgrade_rollback_timeout
      • idc_list_refresh_interval
      • ignore_local_config
      • internal_cmd_mem_limited
      • ip_listen_mode
      • is_need_skip_delay_interval_schema_changed
      • ldg_info_refresh_interval
      • listen_port
      • local_bound_ip
      • local_bound_ipv6_ip
      • log_cleanup_interval
      • log_dir_size_threshold
      • log_file_percentage
      • long_async_task_timeout
      • max_log_file_size
      • max_syslog_file_count
      • max_syslog_file_time
      • mem_leak_check_class_name
      • mem_leak_check_mod_name
      • metadb_server_state_refresh_interval
      • min_congested_connect_timeout
      • min_keep_congestion_interval
      • monitor_cost_ms_unit
      • monitor_item_limit
      • monitor_item_max_idle_period
      • monitor_log_level
      • monitor_stat_dump_interval
      • monitor_stat_high_threshold
      • monitor_stat_low_threshold
      • monitor_stat_middle_threshold
      • need_convert_vip_to_tname
      • net_accept_threads
      • net_config_poll_timeout
      • normal_pl_update_threshold
      • obproxy_config_server_url
      • obproxy_sys_password
      • partition_location_expire_relative_time
      • prometheus_cost_ms_unit
      • prometheus_listen_port
      • prometheus_sync_interval
      • protocol_diagnosis_level
      • proxy_cluster
      • proxy_hot_upgrade_check_interval
      • proxy_id
      • proxy_info_check_interval
      • proxy_local_cmd
      • proxy_mem_limited
      • qa_mode_mock_public_cloud_slb_addr
      • qos_stat_clean_interval
      • qos_stat_item_limit
      • refresh_idc_list
      • refresh_json_config
      • refresh_rslist
      • request_buffer_length
      • rootservice_list
      • rpc_client_net_write_timeout
      • rpc_client_net_read_timeout
      • rpc_async_pull_batch_max_size
      • rpc_async_task_thread_num
      • rpc_ctx_expire_time
      • routing_cache_mem_limited
      • rpc_enable_async_analyze
      • rpc_enable_async_pull_batch_tablets
      • rpc_async_pull_batch_max_times
      • rpc_async_pull_batch_wait_interval
      • rpc_enable_direct_expire_route_entry
      • rpc_enable_congestion
      • rpc_enable_lower_case_table_names
      • rpc_enable_global_index
      • rpc_enable_force_srv_black_list
      • rpc_enable_requestsm_info
      • rpc_enable_reroute
      • rpc_enable_parallel_handler
      • rpc_enable_retry_request_info_log
      • rpc_force_use_original_redis_protocol
      • rpc_enable_sub_req_log
      • rpc_force_srv_black_list
      • rpc_listen_port
      • rpc_max_request_batch_size
      • rpc_max_response_batch_size
      • rpc_max_server_table_entry_num
      • rpc_net_timeout_base
      • rpc_partition_calc_max_retries
      • rpc_redis_operation_timeout
      • rpc_request_server_entry_max_retries
      • rpc_request_timeout
      • rpc_request_max_retries
      • rpc_redis_default_database_name
      • rpc_redis_max_monitor_num
      • rpc_period_task_interval
      • rpc_redis_default_user_name
      • rpc_request_retry_waiting_time
      • rpc_server_entry_expire_time
      • rpc_request_timeout_delta
      • rpc_server_net_handler_expire_time
      • rpc_server_net_invalid_time_us
      • rpc_srv_session_pool_inactive_timeout
      • rpc_service_mode
      • rpc_server_net_max_pending_request
      • rpc_sub_request_isolation_mode
      • rpc_support_key_partition_shard_request
      • rpc_sub_request_weight
      • rpc_sub_req_max_retries
      • scan_buffered_rows_warning_threshold
      • sequence_entry_expire_time
      • sequence_fail_retry_count
      • sequence_prefetch_threshold
      • server_detect_fail_threshold
      • server_detect_mode
      • server_detect_refresh_interval
      • server_protocol
      • server_routing_mode
      • server_state_refresh_interval
      • server_tcp_init_cwnd
      • server_tcp_keepcnt
      • server_tcp_keepidle
      • server_tcp_keepintvl
      • server_tcp_user_timeout
      • session_pool_idle_timeout
      • session_pool_reset_interval
      • session_pool_stat_log_interval
      • session_pool_thread_num
      • session_pool_thread_schedule_interval
      • shard_scan_thread_num
      • short_async_task_timeout
      • skip_proxy_sys_private_check
      • skip_proxyro_check
      • slow_proxy_process_time_threshold
      • slow_transaction_time_threshold
      • sock_option_flag_out
      • sock_packet_mark_out
      • sock_packet_tos_out
      • sock_recv_buffer_size_out
      • sock_send_buffer_size_out
      • sql_table_cache_expire_relative_time
      • sql_table_cache_mem_limited
      • sqlaudit_mem_limited
      • stack_size
      • stat_dump_interval
      • stat_table_sync_interval
      • syslog_io_bandwidth_limit
      • syslog_level
      • table_entry_retry_build_limit
      • task_thread_num
      • tenant_location_valid_time
      • tunnel_request_size_threshold
      • username_separator
      • work_thread_num
      • xflush_log_level
    • Multi-level parameters
      • binlog_service_ip
      • compression_algorithm
      • enable_check_cluster_name
      • enable_client_ssl
      • enable_cloud_full_username
      • enable_read_write_split
      • enable_rpc_throttle
      • enable_server_ssl
      • enable_standby_read_write_split
      • enable_transaction_split
      • enable_weak_reroute
      • init_sql
      • mysql_version
      • ob_max_read_stale_time
      • obproxy_force_parallel_query_dop
      • obproxy_read_consistency
      • obproxy_read_only
      • observer_query_timeout_delta
      • observer_sys_password
      • observer_sys_password1
      • proxy_idc_name
      • proxy_primary_zone_name
      • proxy_route_policy
      • proxy_tenant_name
      • query_digest_time_threshold
      • read_stale_retry_interval
      • rootservice_cluster_name
      • route_diagnosis_level
      • rpc_request_throttle_waiting_time
      • rpc_throttle_limit_qps_qa
      • route_target_replica_type
      • rpc_throttle_trigger_percentage
      • slow_query_time_threshold
      • sql_firewall_config
      • ssl_attributes
      • target_db_server
      • weakread_weight_zone
  • Connection management
    • Principles
    • Session status synchronization
    • Configure a globally unique client session ID
    • Client session
    • Server session
    • Network connection
    • Session connection pool
  • Data routing
    • Factors affecting data routing
    • ODP routing
    • Intra-tenant routing
      • Overview
      • IP address-based routing
      • Partitioned table-based routing for strong-consistency reads
      • Global index table-based routing for strong-consistency reads
      • Replicated table-based routing for strong-consistency reads
      • Primary zone-based routing for strong-consistency reads
      • Strategy-based routing
      • Distributed transaction routing
      • Rerouting
      • Forcible routing
      • Weight-based load-balanced routing
      • Equality derivation for partition calculation
    • Automatic routing to the primary/standby tenants
    • Read/Write separation
    • Follower latency threshold
    • Function partition key routing
      • Overview
      • String functions
      • Numeric calculation functions
      • Date calculation functions
      • FAQ
    • Character set-based routing
    • Partitioning key types supported for routing by ODP
  • Logs
    • Overview
    • obproxy_diagnosis.log
    • obproxy_digest.log
    • obproxy_error.log
    • obproxy_slow.log
    • obproxy_stat.log
    • obproxy.log
  • Commands
    • Overview
    • Dedicated ODP commands
      • ALTER
      • KILL
        • KILL GLOBALSESSION
        • KILL PROXYSESSION
      • ping
      • SHOW
        • SHOW
        • SHOW GLOBALSESSION
        • SHOW PROXYPS
    • Compatible MySQL commands
      • BINLOG
      • KILL
      • SHOW PROCESSLIST
      • SHOW RELAYLOG EVENTS
      • SHOW SLAVE HOSTS
  • High availability mechanism
    • Overview
    • High availability of ODP services
    • High availability of OceanBase Database
    • High availability testing
  • OBKV
    • RPC service port
    • Throttling
  • Security and protocols
  • Operation and maintenance
    • Troubleshooting logic
    • Performance analysis
    • Show Trace
    • Routing diagnostics
      • Overview
      • Obtain diagnostic information
      • Diagnostic point troubleshooting
        • Overview
        • SQL_PARSE
        • ROUTE_INFO
        • LOCATION_CACHE_LOOKUP
        • ROUTINE_ENTRY_LOOKUP_DONE
        • FETCH_TABLE_RELATED_DATA
        • TABLE_ENTRY_LOOKUP_DONE
        • EXPR_PARSE
        • CALC_ROWID
        • RESOLVE_TOKEN
        • RESOLVE_EXPR
        • CALC_PARTITION_ID
        • PARTITION_ID_CALC_DONE
        • PARTITION_ENTRY_LOOKUP_DONE
        • ROUTE_POLICY
        • CONGESTION_CONTROL
        • RETRY
        • HANDLE_RESPONSE
      • Examples
    • Memory leak diagnostics
    • Connection diagnostics
    • Prometheus monitoring
    • SQL firewall
  • Release Notes
    • Version number rules
    • Enterprise Edition
      • V4.3
        • OceanBase Database Proxy Enterprise Edition V4.3.6
        • OceanBase Database Proxy Enterprise Edition V4.3.5
        • OceanBase Database Enterprise Edition V4.3.4
        • ODP Enterprise Edition V4.3.3
        • ODP Enterprise Edition V4.3.2
        • ODP Enterprise Edition V4.3.1
        • ODP Enterprise Edition V4.3.0
      • V4.2
        • ODP Enterprise Edition V4.2.3
        • ODP Enterprise Edition V4.2.2
        • ODP Enterprise Edition V4.2.1
      • V4.1
        • ODP Enterprise Edition V4.1.0
      • V4.0
        • ODP Enterprise Edition V4.0.0
      • V3.2
        • ODP Enterprise Edition V3.2.11
        • ODP Enterprise Edition V3.2.3.5
    • Community Edition
      • V4.3
        • OceanBase Database Proxy Community Edition V4.3.6
        • OceanBase Database Proxy Community Edition V4.3.5
        • OceanBase Database Proxy Community Edition V4.3.4
        • ODP Community Edition V4.3.3
        • ODP Community Edition V4.3.2
        • ODP Community Edition V4.3.1
      • V4.2
        • ODP Community Edition V4.2.3
        • ODP Community Edition V4.2.1
        • ODP Community Edition V4.2.0
      • V4.1
        • ODP Community Edition V4.1.0
      • V4.0
        • ODP Community Edition V4.0.0

Download PDF

Document Feedback
  1. Documentation Center
  2. OceanBase Database Proxy
  3. V4.3.6

Show Trace

Last Updated:2026-09-04 08:23:04

Version requirements
Considerations
Step 2: Enable the Show Trace feature and execute the target SQL
Step 3: Use Show Trace
Step 4: Disable the Show Trace feature

The Show Trace feature allows you to interactively view the call chain and the time spent in each stage during the execution of the last SQL request. This feature is useful for performance analysis and optimization. You can easily identify performance bottlenecks using the Show Trace feature.

Version requirements

  • OceanBase Database: V4.2.0 and later

  • ODP: V4.2.0 and later

  • OCP: V4.0.3 and later

Considerations

OceanBase Database supports the Show Trace feature starting from V4.2.0, based on the OceanBase 2.0 protocol. Please note the following points about this feature.

  • When using compatible component versions, you can enable the Show Trace feature at the session level by using the feature switch. Once enabled, ODP and OceanBase Database will record detailed interaction information for every subsequent SQL executed. After the SQL execution is complete, you can simply execute the show trace; command to view the diagnostic information generated by the last SQL.

    ```shell
    obclient> alter proxyconfig set server_protocol = 'Auto';
    obclient> alter proxyconfig set enable_single_leader_node_routing = False;
    ```
    
    • Method 2: Directly set server_protocol to OceanBase 2.0.

      obclient> alter proxyconfig set server_protocol = 'OceanBase 2.0';
      
  1. Enable trace statistics in ODP.

    Set enable_full_link_trace to True to enable the full-link tracing feature for query execution tracking.

    obclient> alter proxyconfig set enable_full_link_trace = True;
    

Step 2: Enable the Show Trace feature and execute the target SQL

Log in to the OceanBase cluster as a user tenant and perform the following steps.

  1. Enable Show Trace at the session level.

    Set ob_enable_show_trace to ON to enable the Show Trace feature.

    obclient> set ob_enable_show_trace= 'ON';
    
  2. Execute the target SQL. For example, execute the show tables; command.

    obclient> show tables;
    

    The output is as follows:

    +----------------------------+
    | Tables_in_test             |
    +----------------------------+
    | t                          |
    | t1                         |
    | t2                         |
    +----------------------------+
    3 rows in set
    

Step 3: Use Show Trace

You can execute the show trace; command to obtain the result set echo or the show trace format='json'; command to obtain the result set in JSON format.

  • Execute the show trace; command to obtain the result set echo.

    obclient> show trace;
    

    The output is as follows:

    +-----------------------------------------------+----------------------------+------------+
    | Operation                                     | StartTime                  | ElapseTime |
    +-----------------------------------------------+----------------------------+------------+
    | ob_proxy                                      | 2026-01-08 15:17:24.555215 | 12.414 ms  |
    | ├── ob_proxy_partition_location_lookup        | 2026-01-08 15:17:24.555411 | 0.010 ms   |
    | ├── ob_proxy_server_process_req               | 2026-01-08 15:17:24.555813 | 10.150 ms  |
    | └── com_query_process                         | 2026-01-08 15:17:24.555989 | 10.265 ms  |
    |     └── mpquery_single_stmt                   | 2026-01-08 15:17:24.556058 | 10.172 ms  |
    |         ├── sql_compile                       | 2026-01-08 15:17:24.556137 | 7.300 ms   |
    |         │   ├── pc_get_plan                   | 2026-01-08 15:17:24.556230 | 0.016 ms   |
    |         │   └── hard_parse                    | 2026-01-08 15:17:24.556370 | 7.014 ms   |
    |         │       ├── parse                     | 2026-01-08 15:17:24.556396 | 0.044 ms   |
    |         │       ├── resolve                   | 2026-01-08 15:17:24.556526 | 1.866 ms   |
    |         │       ├── rewrite                   | 2026-01-08 15:17:24.558557 | 2.020 ms   |
    |         │       ├── optimize                  | 2026-01-08 15:17:24.560613 | 1.928 ms   |
    |         │       └── code_generate             | 2026-01-08 15:17:24.562580 | 0.428 ms   |
    |         └── sql_execute                       | 2026-01-08 15:17:24.563462 | 2.457 ms   |
    |             ├── open                          | 2026-01-08 15:17:24.563469 | 0.089 ms   |
    |             ├── response_result               | 2026-01-08 15:17:24.563614 | 1.620 ms   |
    |             │   └── do_local_das_task         | 2026-01-08 15:17:24.563716 | 1.025 ms   |
    |             └── close                         | 2026-01-08 15:17:24.565277 | 0.342 ms   |
    |                 ├── close_das_task            | 2026-01-08 15:17:24.565294 | 0.028 ms   |
    |                 └── end_transaction           | 2026-01-08 15:17:24.565551 | 0.036 ms   |
    +-----------------------------------------------+----------------------------+------------+
    20 rows in set
    

    From the above echo, you can first scope the problem and analyze it by examining the time spent at the following key points, which can help you quickly identify the overall database execution time and provide further analysis and optimization.

    • ob_proxy is the starting point of ODP, recording the time from when ODP receives the SQL request to when it provides a complete response to the client.

    • ob_proxy_server_process_req indicates the time from when the SQL request is sent to when the first response is received from an OBServer node, equal to the OBServer node processing time plus the network return time.

    • com_query_process is the total point for OceanBase Database, recording the time from when an OBServer node receives the SQL request to when it forwards the response.

  • Execute the show trace format='json'; command to obtain the result set in JSON format.

    Executing the show trace format = 'json'; command will return the result in JSON format, which can be formatted for easier collection and analysis, as shown in the following figure.
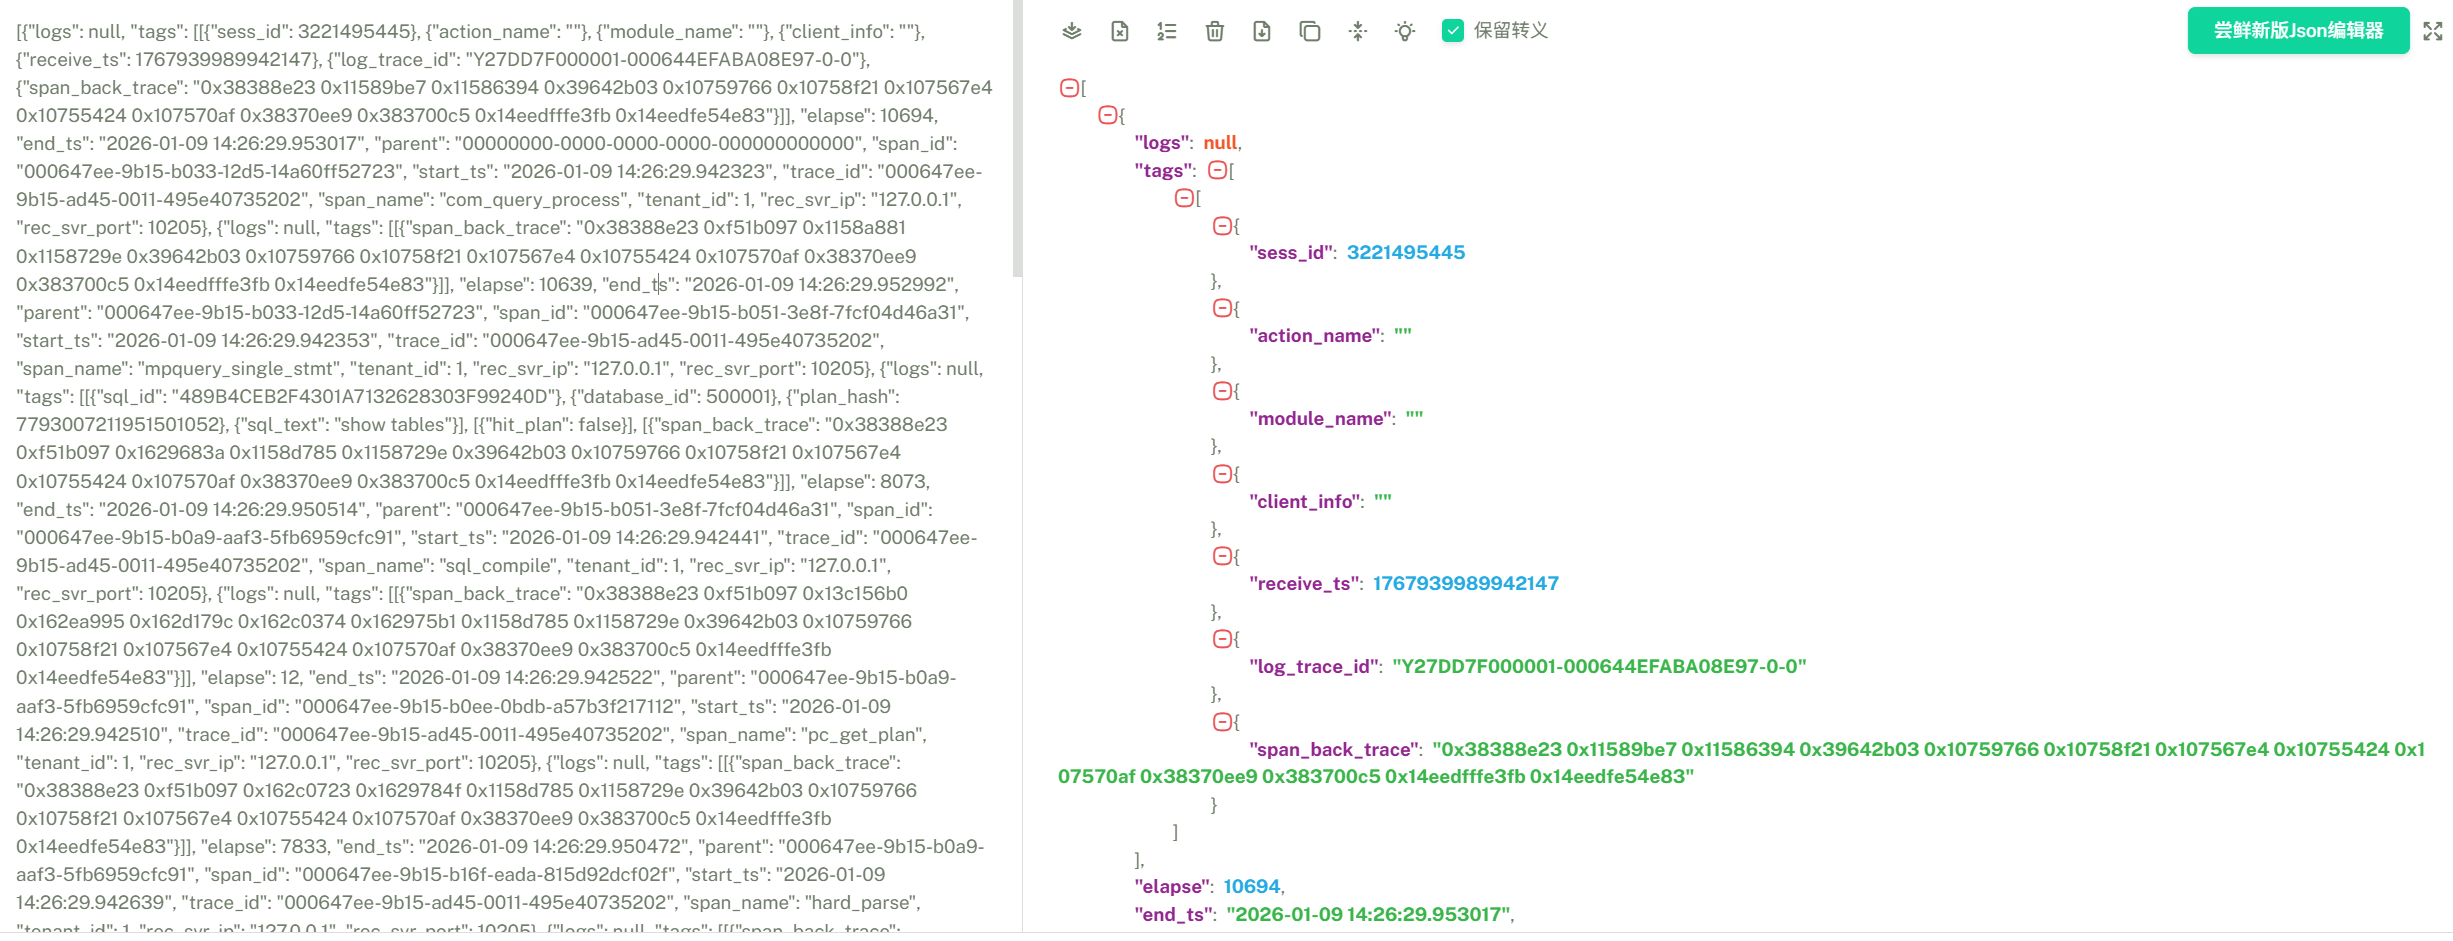
    Figure 1

You can repeatedly execute the show trace; or show trace format='json'; command to observe the real-time echo.

Step 4: Disable the Show Trace feature

After analysis is complete, execute the following command to disable Show Trace at the session level to avoid performance impact.

obclient> set ob_enable_show_trace= 'OFF';

Previous topic

Performance analysis
Last

Next topic

Overview
Next
on this page
Version requirements
Considerations
Step 2: Enable the Show Trace feature and execute the target SQL
Step 3: Use Show Trace
Step 4: Disable the Show Trace feature